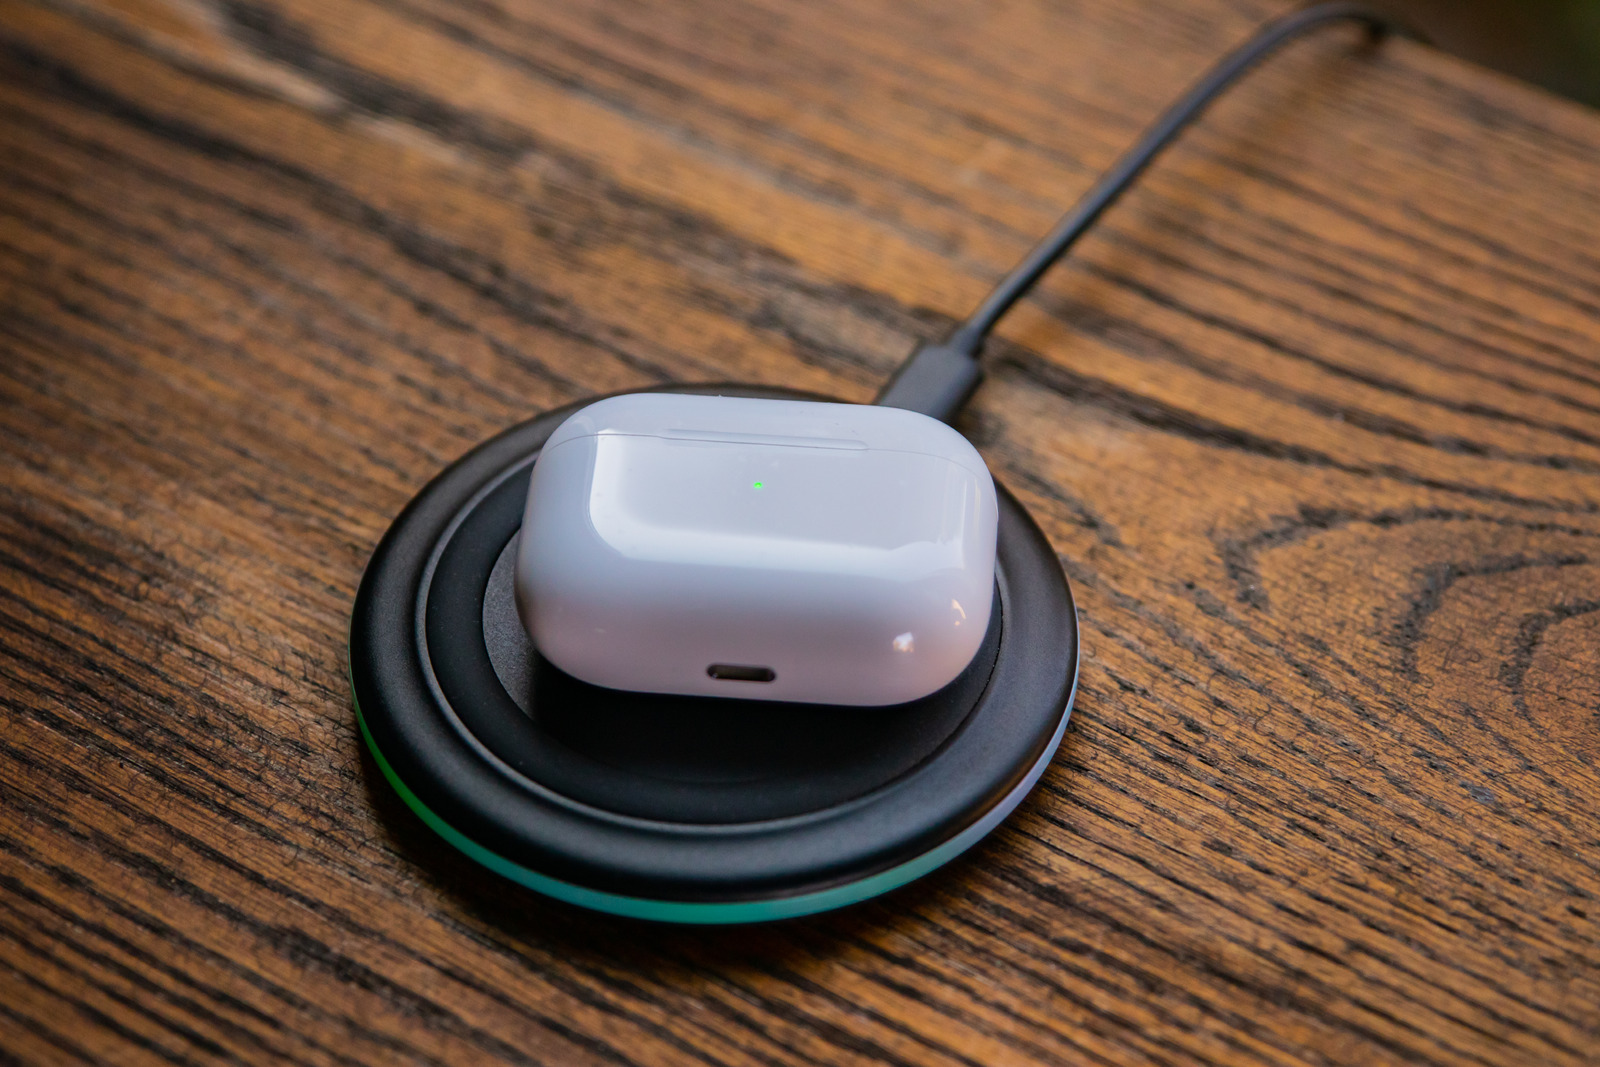
How to Charge AirPods Without a Case
Discover the truth about how to charge AirPods without a case. Uncover myths, find alternatives, and safeguard your audio experience.

With tons of brands and models to choose from, it can be difficult to pick out headphones that have well-intended sound at a fair price. If you are a gamer like me, you would be tempted to look at the spec sheet/data sheet and try to compare specs with other audio devices.
Although the specs contain a good amount of data regarding the headphones (and their potential sound quality), reading the specs themselves is not enough; you need to look for their frequency response.
With that said, you might be thinking: What frequency response is, and how to spot headphones with a good frequency response?
Broadly speaking, headphones will always have a decent frequency response if they can at least produce audio within the audible sound range of 20Hz-20kHz, and have an overall flat frequency response graph.
However, a perfectly flat response may not be what you are looking for in terms of sound quality. So to help you understand more about the frequency response of headphones and how it relates to actual sound, let’s talk more about related topics such as:
Let’s begin.
Understanding the frequency response of headphones (whether that’s the frequency range or frequency response curve) can go a long way in helping you pick out devices with a more balanced sound and better sound signature.
Therefore, understanding these specifications is necessary, especially if you hope to purchase an expensive pair of headphones for gaming or work.
Understanding the Frequency response characteristic of a pair of headphones (or speakers) will help you find a device with the best value for money; hence, you won’t have to spend too much on audiophile open-backs or studio headphones.
Even though most high-end expensive brands happen to produce headphones with better sound quality, you shouldn’t always try to correlate price with the quality of sound, especially since people have different requirements and listening experiences. Therefore, instead of using price, the best variable to help you find high-quality headphones (that suit your needs) is to use the frequency response as a decision factor. (in some cases: the sole factor.)
Now we understand that the frequency response is essential for better quality audio. That said, we should try to learn how to size up the frequency response of headphones in order to make an educated decision.
There are two specifications you need to be concerned about when it comes to frequency response: frequency range and frequency response curve.
Most headphones list the frequency ranges within their spec sheet (alongside well-known specs such as headphone impedance, THD, and maximum dB SPL). However, only a select few would publish the frequency response curve: the most important specification out of the two.
Unfortunately, manufacturers and brands rarely publish their frequency response curves; hence, it is difficult to decide without a tolerance value or standard frequency response curve.
The frequency range specification determines the sound frequencies the headphones are capable of recreating. Most mid-range headphones will have a range of 20Hz-20kHz, i.e., the human audible range. Meanwhile, other devices (ones on either end of the “budget” spectrum) can have a narrower or a wider range (such as 5Hz-20kHz or 100Hz-15kHz).
Even though having a wide range is always better, you shouldn’t judge the performance of headphones by the range itself. These headphones might be able to output sound waves at these frequencies, but they might not stay true (or complement) the original audio signals.
Therefore, we need to visualize the performance of these headphones under the entire frequency ranges it is supposed to cover, and that is where the frequency response curve comes into play.
A frequency response curve is a bode plot that measures the loudness of the audio signal (in dB) with reference to the frequency of that signal. (Hence the term “frequency” response curve), and this curve is generated by performing tests under laboratory-like conditions (more on that later).
As I mentioned, many manufacturers are shy about taking these measurements or publishing them. Fortunately, many third-party tech reviewers (such as Inner Fidelity and RTINGS) have carried out their own tests and created response curves for many headphones and speakers. Therefore, the only way to get the best frequency response curves (for most well-known devices) is with the help of these third-party reviewers.
The frequency response tells us a lot of information regarding the audio quality of headphones, and reading a response curve might seem difficult at first.
Thankfully, anybody can decipher a response curve as long as you know how to differentiate the raw frequency graph from the compensated graph and compare the measurements with the target flat response.
Whenever you start to read a response graph, you will have two sets of readings: the raw and the compensated response. To understand how they look, let’s talk about Inner Fidelity’s response curve for the Audio Technica ATH-M50X.
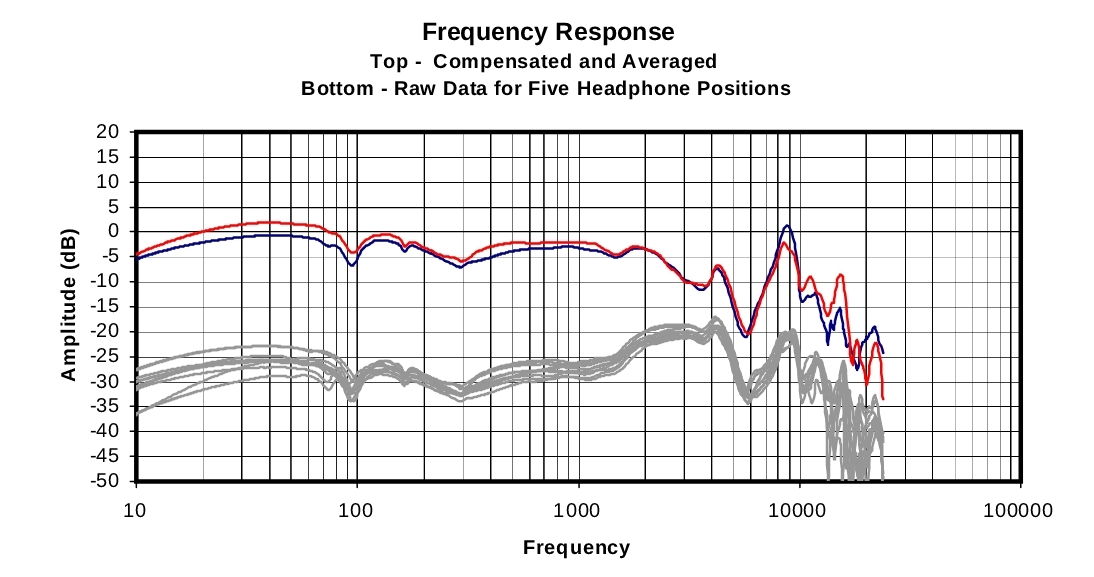
If you open up the curve, it has two sets of graphs: the compensated curve on the top and the raw measurements on the bottom.
Since the overall shape of these graphs looks (a lot) similar, you can get an idea of the headphone’s frequency responses by looking at any single curve.
However, I always recommend checking out the compensated and averaged graph at the top because it has taken into account all the different raw measurement variations (by averaging them) and added the target headphone frequency responses. (A sort of standard graph for all headphones.)
So if are ever looking up a response graph from any reviewer site, make sure to check the compensated response as it is the most reliable and will give you the most accurate visualization of the headphone’s performance.
Apart from considering the differences between the compensated response and raw measurements, we need to consider the shape of the response curve in comparison to the perfectly flat response.
A perfectly flat response may “sound” like it would have an excellent sound quality, but in practice, it’s difficult to recreate, and in most instances (apart from studio work), listeners’ would not enjoy it. Headphones with a flat curve won’t offer a great bass response since they rely on smaller drivers.
To combat this, the headphone’s frequency response needs to be altered or “colored.” We’ll see how this takes place when comparing different headphones in the section below.
Let’s get into some practical examples by comparing headphones frequency response for different types of over-ear and in-ear headphones. For this section, I’ll go over some of the best headphones in the market covering several niches such as:
First up, let’s consider one of our best closed-back headphones, the Meze 99 Classics. It is a premium pair of over-ear headphones with a 40mm dynamic driver and a sensitivity of 103dB at 1kHz/1mW. Its frequency range is 15Hz-25kHz.
From the frequency response graph, we can see that it starts at a slightly lower bass response (almost -10dB) but slowly works up and remains stable until the mid-range. After that, it keeps stabilizing throughout the entire midrange (250Hz-2kHz) after which it starts to drop off at the high-end and starts at around 4kHz.
So considering this graph, we can safely conclude that the Meze 99 Classics has more neutral bass frequencies that are on par with the mid-range; hence, this pair of headphones do not have to provide too much artificial bass boost to make you feel it.
The high-end drop-off is a common phenomenon and there’s nothing too concerning as there are fewer up and down variations.
All things considered, the Meze 99 Classics has a wide frequency range with most of the promised frequencies sounding very natural. Also, from the raw response curve, you can see it is somewhat similar to the target curve.
Now, let’s consider a well-known pair of open-backs, namely the Sennheiser HD600 from our list of the best open-back headphones. This bad boy has 40mm drivers, a sensitivity of 97dB sensitivity and a frequency range of 12Hz-39kHz.
When looking at the frequency graph of the HD600s, we can see that it’s got decent bass frequencies starting at -10dB. After that, it has a very stable mid-range response until it starts rolling off at around 5kHz.
From this graph and our own experience, we can safely vouch for this pair of headphones. It doesn’t have deep bass to knock your socks off, but the bass and mids come out very clean and organic. Unfortunately, most of the treble sounds can be a bit overwhelming.
Compared to the Meze 99, the bass-mid response is very much the same; hence, you can expect the same amount of sound quality from these devices as long as you utilize them in environments with minimum ambient noise. (Especially the open-backed HD600.)
Another Sennheiser product, this HD 280 Pro is one of the best closed-back studio headphones for bass guitar and for aspiring sound mixers/engineers. It’s got a frequency range of 8Hz-25kHz.
From the response curve of the Sennheiser HD 280 Pro, we can see that the overall trend is very flat except for a slight dip in the upper-base frequencies. Despite this, the headphones’ frequency response is very neutral and balanced, resulting in an almost perfect frequency response for studio work.
Headphones aside, let’s check out the response curves for the Shure SE846, one of the best in-ear monitors that have a range of 15Hz-20kHz.
As you can see, the shape of the curve is very different from that of over-ear headphones. Due to the smaller form factor, the Shure SE846 IEMs had to emphasize the bass frequencies; hence the sub-bass range peaks at 5dB and starts dropping consistently.
During the mids, it has a neutral frequency response, and it’s only after 10KHz in the treble/highs that the high-end drop-off begins.
All things considered, these IEMs do a very good job of isolating background noise and pumping up bass sounds to create a more immersive listening experience. Depending on your use-cases, they might be even better than bulky over-ear headphones.
Finally, let’s talk about the most famous pair of earbuds: the Apple EarPods (not the AirPods.) These devices, although no longer in circulation, had impressive sound quality and a range of almost 5Hz-21kHz.
Compared to modern earbuds and in-ear monitors, the bass frequencies are underpowered, and it only peaks at around 100Hz with no significant boosting (almost 0dB sensitivity). Nonetheless, the mids and highs are decent, with only a narrow band of frequencies in the upper mids and lower treble having higher sensitivity.
The bass response of the earpods is not one of its strong points, mostly due to the small size and open-speaker design. The Earpods don’t provide a suitable (confined) space for the bass frequencies to flourish.
Thankfully, the mids and highs are quite good, so you can use the earpods to enjoy podcasts and specific genres of music in a quiet environment.
So, if you are looking for decent headphones, check if the frequency range covers the audible frequencies of 20Hz-20kHz, and has a response curve that has a somewhat neutral bass, mids, and treble frequency response.
When it comes to gauging the quality of headphones, the frequency response spec is kind of a big deal. Although many manufacturers would only publish the frequency range, the response curve is more important.
Luckily, users can find the frequency response graphs of many widely-used headphones and figure out for themselves if a certain pair will suit their requirements. However, they need to be able to read the graphs and decipher them, a feat which is not so difficult if you follow the above examples and tips on how to understand the curve. Ironically, when it comes to headphones and speakers “Flattening the curve” is not recommended.